What happens hundreds of meters below the surface of the glacier Kongsvegen?
Researchers from the University of Oslo has drilled their way down to the bottom of the Kongsvegen glacier. Read about why and how they do this in this letter from the project that listens to the destabilisation of Arctic glaciers: The MAMMAMIA-project!
August 22nd 2022
Kongsvegen glacier, 20 km west of Ny Alesund, Svalbard.
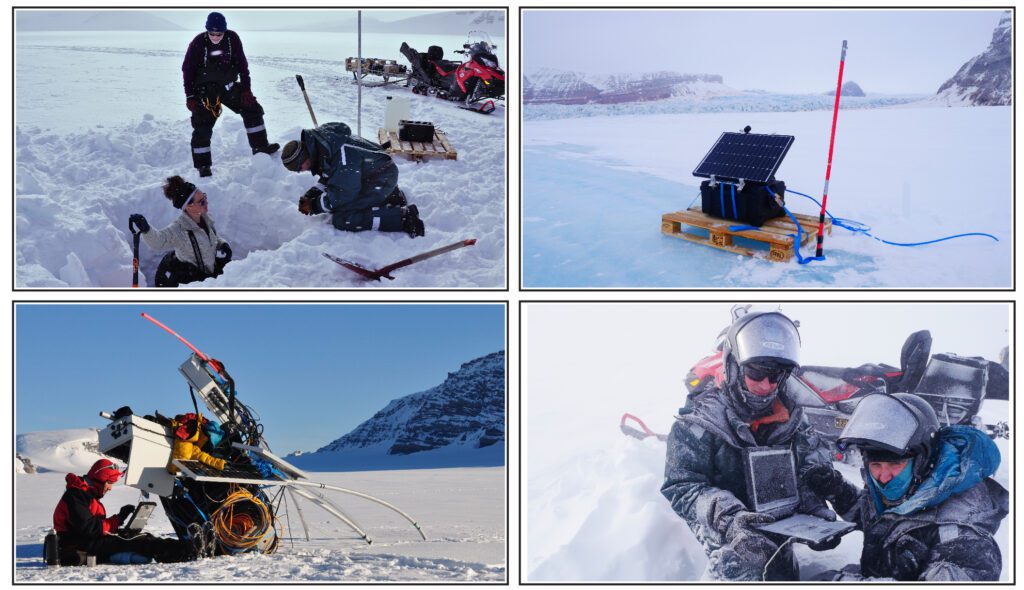
This is it, we have reached the bottom of the glacier. 327 m below our feet, our hot water jet lands on the sediments after more than 6 hours drilling through the ice. The hose that connects it to the surface stops rolling and Thomas, the project leader, confirms that the base has been reached. I get off the helicopter at this time and Coline, the PhD student of the project, tells me the good news. A sigh of relief goes through us, especially for John, the project engineer, and Svein, the mechanic from the Norwegian Polar Institute. We had tried the same operation last spring, but the 30-degree below-zero temperatures froze the water in the drilling system, making it impossible to continue the operation. This time, the engines that are still running bring the smell of diesel on these frozen lands.
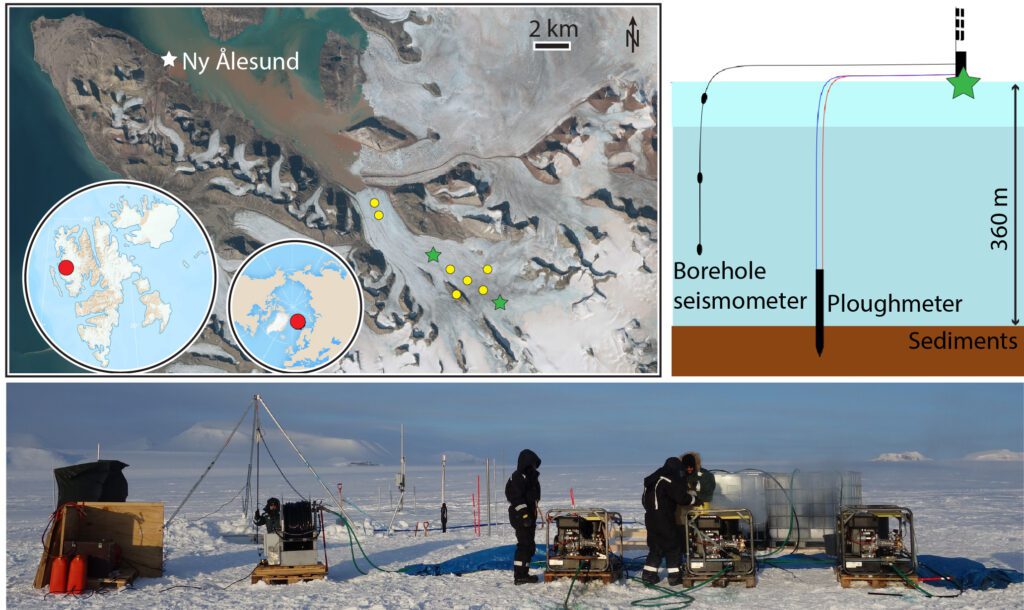
Our goal here is not to go back in time through the ice cores like the missions in Antarctica or Greenland. Our aim is to explore what happens hundreds of metres below the surface, where the glacier rests on its bed of rocks and sediments (Figure 1). This is where its stability is at stake.
These ice dragons, which seem to be asleep to us, can wake up a little too suddenly, as shown by the collapse of glaciers in the Alps this summer. Their movement (from a few metres to several km per year) is similar to that of a cheese on a sloping board, they deform over their entire height and creep under their own weight.
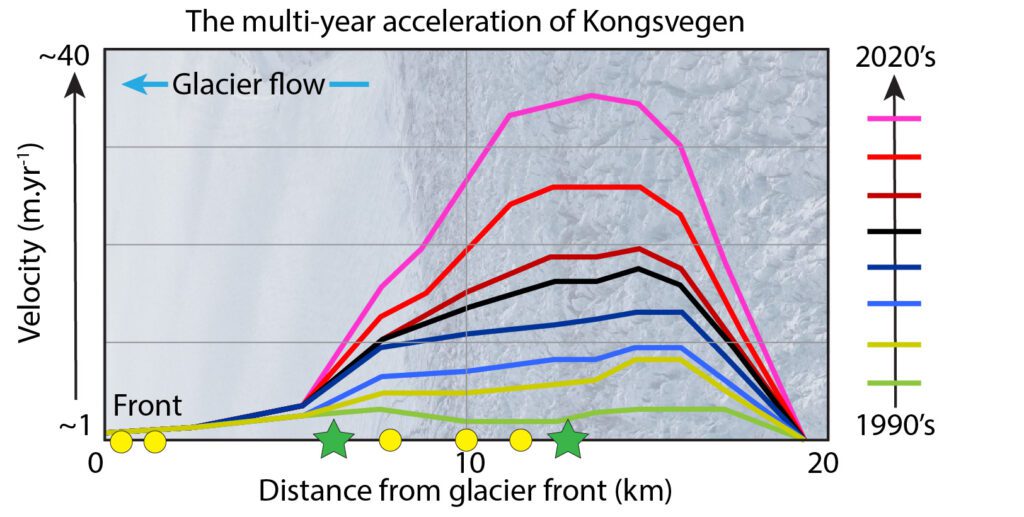
The steeper and thicker they are (up to several km), the faster they rush to lower altitudes. Between the ice and its rocky bed, liquid water from the surface seeps in and acts as a lubricant. Thanks to this thin layer of water, glaciers can double their speed between winter and summer. While most glaciers have such a stable seasonal cycle, some, including Kongsvegen, which hosts our adventures, also see their annual speed increase over the years. This is known as a glacial surge.
Since 2010, the upper part of Kongsvegen has increased from a few m/yr to more than 50 m/yr (Figure 2), an acceleration of almost 1000%. For the time being, this only concerns the upper part of the glacier, but we are seeing a progression from year to year towards the lower areas. We believe that this dynamic could lead to a destabilisation of the glacier.
If this happens, this ice dragon, which is more than 15 km long, 300 m thick and 2 km wide, could rush into the ocean and cause major damage to the entire fjord. And Kongsvegen is just one of thousands of cases. To understand this, we melt our way down and plunge our instruments into the unknown bowels of the glacier.
Our scientific mission is based on listening to Kongsvegen and measuring its forces. Coline is in charge of the forces, and I am in charge of listening. Glaciers are not silent and the slightest movement generates a vibration that contains crucial information about their dynamics (visit this blog to learn more and hear the sound of glaciers).
My job is to analyse these vibrations to understand how the glacier moves, how it reacts to surface melting, how its crevasses open and what is happening in its depths. To do this, we use seismometers, traditionally used to study earthquakes. Since 2020, we have installed about 20 of these along the length of Kongsvegen and in its depths (up to 250 m below the surface, Figures 1, 3). With such a 3D network, we can ‘listen’ to the whole glacier, like a doctor with a stethoscope, and image its secrets.
Alongside these seismometers, we have also installed a rather unusual instrument, a ploughmeter, a long 2m steel rod planted at a depth of 350m (Figure 1.). On this rod, John installed several strain gauges to measure the forces at the base of the glacier. The ploughmeter we installed this summer only transmitted its measurements for a few hours before becoming silent despite the days John spent trying to wake it up. Fortunately for Coline, whose PhD is partly based on these measurements, the one installed in Spring 2021 in still talking. Thus, we have been measuring, since spring 2021, how the glacier vibrates, deforms and slides in response to changes in temperature and precipitation.
Collecting this data was lot of fun and good moments, but also time consuming, expensive and subject to many uncertainties. This was made possible thanks to the supports of numerous colleagues as well as from the Norwegian Polar Institute and the Sverdrup Station in Ny Ålesund. This is how research works. This is how the words are formed of a story that will join so many others in the library of knowledge that allows us, citizens or decision-makers, to understand the world we depend on.
Back from the field, long months pass, in front of our computer or around a table, converting, filtering, comparing and looking again and again at the curves drawn by our observations. We find that the dynamics of Kongsvegen is governed by a melt season, from June to October, during which several thousands of litres of water flow every second over the surface and base of the glacier (blue curve, Figure 4).
All this water lubricates the base of the glacier and causes an increase in the velocity and stresses inside the glacier (green and red curve, Figure 4). At the same time, we measure an increase in the intensity of glacial vibrations, related to hydrological noise and intense crevasse activity under the influence of summer heat and glacier acceleration (black curve, Figure 4).

This summer we observed an increased presence of crevasses and measured an increase in stress compared to last year. This could be a sign of a strong acceleration or even destabilisation of this ice dragon. Our team, together with several colleagues, is currently analysing these results to quantify the causes of these changes, and thus better understand what leads to the destabilisation of a glacier.
We will keep you posted!
Best,
Ugo Nanni,
Researcher at University of Oslo
Further reading:
A bit more about seismic measurements on glaciers
The website of the MAMMAMIA project
A blog post explaining the Marmolada collapse
Click this link to hear the sound of glaciers!
Link to the Norwegian research station in Ny Ålesund that hosts during our mission
Did you find what you were looking for?