Photo: Antonello Provenzale, CNR
The changing Arctic critical zone
By: Mariasilvia Giamberini, Ilaria Baneschi, Marta Magnani, Gianna Vivaldo, Antonello Provenzale, Institute of Geoscience and Earth Resources, National Research Council of Italy, Italy
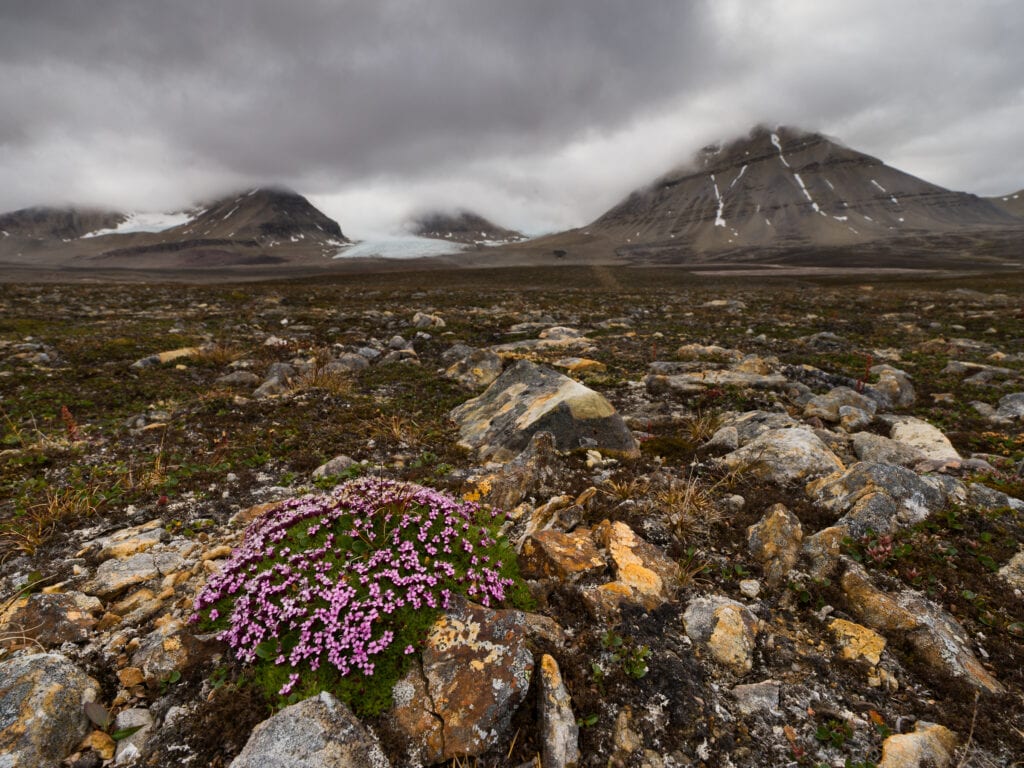
Terrestrial ecosystems are complex systems where biotic and abiotic components are strongly interconnected and respond to environmental and climate stress. The tundra constitutes the life support system of such ecosystems in the Arctic, and it is particularly fragile and exposed to climate change. It is therefore important to understand its functioning and dynamics. For this purpose, we are aiming to establish the first High Arctic “Critical Zone” observatory in the Bayelva basin in the Brøgger peninsula, just outside Ny-Ålesund.
But….what is the Critical Zone?
This term has been introduced between 2000 and 2006 to mean the “heterogeneous, near surface environment in which complex interactions involving rock, soil, water, air, and living organisms regulate the natural habitat and determine the availability of life-sustaining resources” (National Research Council of the USA, 2001 [1]). The “Critical Zone” scientific approach considers the biotic and abiotic interactions as a continuum, where the partition between the standard scientific disciplines does not mean that the phenomena are correspondingly separated as such. On the contrary, this field of science includes all aspects of chemistry, biology, physics, and geology as a way to interpret a complex system where living and non-living components are strongly interconnected.
Our measurements
In the Bayelva Critical Zone Observatory we started to investigate the carbon dioxide fluxes between soil, vegetation and atmosphere. In fact, the carbon stock is a crucial property of the tundra, and we need to understand how it is changing and what are the most important drivers, in order to assess its contribution to the carbon balance in vegetation modelling and hence in Earth System modelling.
CO2 is constantly exchanged between soil and atmosphere through the action of vegetation and microorganisms: plants, lichens and photosynthesizing bacteria capture light and atmospheric CO2 through photosynthesis to produce organic substances, storing energy and transferring it to the whole ecosystem through the food web. Moreover, part of this energy is exploited both by plant themselves, which employ it for their living functions, re-emitting CO2 through cell respiration (Autotrophic respiration, AR), and by heterotrophic soil microorganisms which decompose organic matter by breathing and producing CO2 (Heterotrophic respiration, HR). The sum of the two respiration components forms the Ecosystem Respiration (ER). The flux of CO2 used to build new organic matter is called Gross Primary Production (GPP), while the difference between the GPP and ER is called Net Ecosystem Productivity (NEP) or Net Ecosystem Exchange (NEE). New soil is formed when the yearly budget between GPP and ER is negative, i.e. when NEE is negative and new carbon is stored into the soil. In this case, the ecosystem is a carbon sink. In the global carbon cycle, usually forests, grasslands and tundra act as weak carbon sinks, and slowly store more and more carbon into the soil system. This slow mechanism has contributed to regulate the climate as we know it.
Our methods
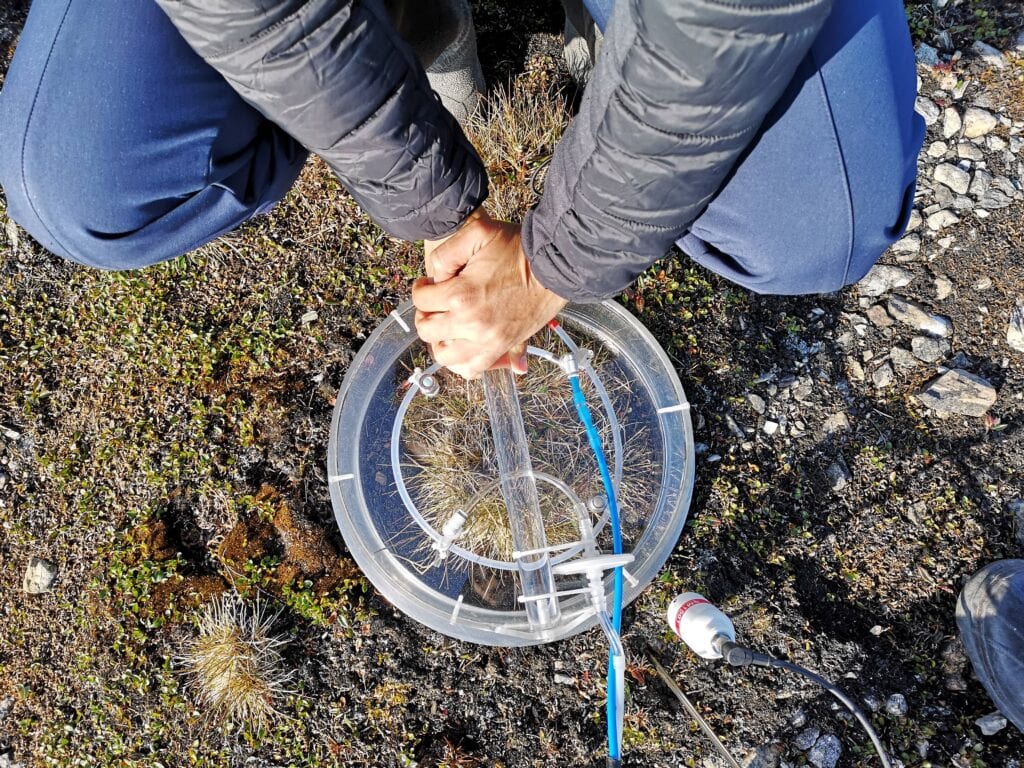
But, what will happen to the tundra carbon fluxes and in the tundra carbon stock when temperatures rise? In a situation of thawing permafrost, more and more organic matter is available in the active layer for bacterial decomposition. At the same time, the widening of the vegetative season, the fertilization effect and vegetation composition shifts may cause an increase of carbon uptake. As a first attempt to understand the trends in future balance between gross primary production and respiration, it is necessary to identify the main drivers of such fluxes. As the tundra is very heterogenous, the spatial scale and representativeness are important factors to take into account. We can measure carbon fluxes from vegetation at several scales: micrometeorological methods (e.g. Eddy Covariance (EC) methodology) turns to be particularly suitable to measure the average turbulent flux “at ecosystem scale”, within a distance of approximatively a few tens of meters from the measurement apparatus. In particular, EC allows to measure the Net Ecosystem Exchange during the day. Respiration is measured during the night, when photosynthesis is off. Daytime respiration is then derived from a mathematical model that takes into account the temperature difference, mainly. At smaller scales, Net Ecosystem Exchange and Ecosystem Respiration can be measured with the Enclosed Chamber method: a closed chamber is posed on the soil and the inner concentration of CO2 is measured for about one minute: if respiration prevails, concentration will increase. If the uptake through photosynthesis prevails, then the CO2 concentration will decrease. With the flux chamber, it is possible to measure the Ecosystem Respiration during the day just covering the chamber with a black shield.
The two methods can be complementary. We use both of them in the Bayelva basin: an Eddy Covariance system is installed at the Climate Change Tower at a height of about 8 meters above the ground, while chamber measurements are made on points characterized by different vegetation cover, where the fluxes are related to the kind of plants and extent of green cover through digital images. The extensive measurements done during summer 2019 let us derive an empirical model that identifies the main drivers of the carbon fluxes.
Preliminary results
The preliminary results have been presented at EGU 2020 [2] and EGU 2021 [3] and will be published on a scientific paper soon. Besides radiation and soil temperature, the main drivers have been found to be soil moisture and green cover. This coming summer, we plan to concentrate the efforts on comparing Eddy Covariance and flux chamber measurements.
Overall, such results will have relevant implications on modelling carbon fluxes in the tundra. At present, vegetation models that are used in global climate models operate only at a large scale (10 – 100 km), while small scale variability is not taken into account. In addition, they are affected by very large uncertainties that need to be reduced to properly predict the changes in soil and vegetation CO2 budget. Deriving new, small-scale models based on measured data can help bridging the gap between the large-scale climate-vegetation models and the reality of carbon and water exchanges.
References
- Front Matter | Basic Research Opportunities in Earth Science | The National Academies Press. doi:10.17226/9981.
- Giamberini, M., Baneschi, I., Lelli, M., Magnani, M., Raco, B., & Provenzale, A. (2020, May). A Critical Zone Approach to Carbon Fluxes in the Arctic Tundra. In EGU General Assembly Conference Abstracts (p. 2956).
- Magnani, M., Baneschi, I., Gaimberini, M., & Provenzale, A. (2021). Drivers of carbon dioxide fluxes in high-Arctic tundra: data-driven models (No. EGU21-5665). Copernicus Meetings.
Did you find what you were looking for?